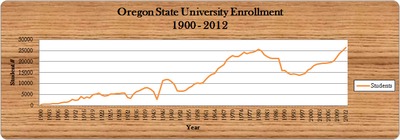
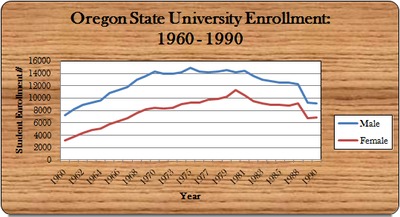
A general overview of the student population on campus throughout these years.
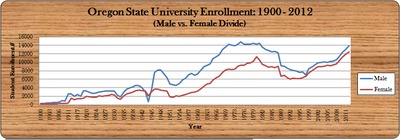
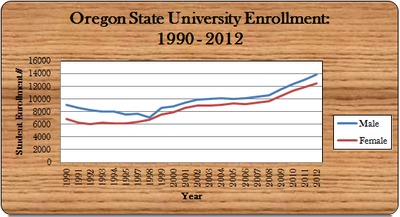
Similar to the graph above, but with the male vs. female breakdown.
Although there were consistently a higher number of male students on campus, the number of female students continued to rise along with them.
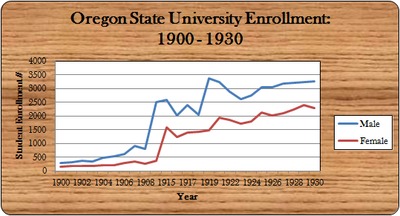
After WWI, there was a surge of students attending college nationwide. As you can see (spike after 1918) OSU was no exception.
Waldo Fact: Around 1910 Waldo Hall could accommodate 170 female students. This worked until September 1912 when they received 197 applications, forcing OSU to find approved boarding places in the city for them.
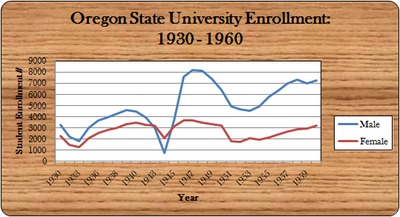
This graph shows a rarity in the Oregon State University enrollment history: for exactly 2 years (1943 and 1944) there were more female students than male students. This is due to WWII (1941 - 1945) and to this day remains the only time there were more female students than male.
The "G.I. Bill" can most likely explain the direct rise in enrollment rates for males after 1944.
Although attending higher education was becoming more common among US youth, the slight increase towards the end of the 1960's could be attributed to the increase of young men avoiding the war draft.
Although women currently outnumber men in US colleges, OSU remains to be an exception to that trend. The numbers for both men and women have increased very steadily the past two decades, and at what seems to be a parallel rate. It will be interesting to see what the future holds for Oregon State University.

